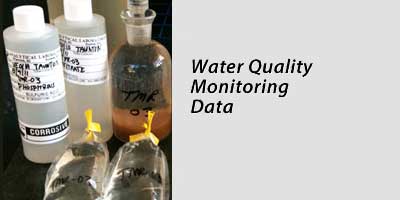
To gauge the health of our waterways, a dedicated crew of volunteers performs monthly testing at 20 sites on the Taunton River and tributaries, measuring levels of nitrate, total phosphorus, bacteria, dissolved oxygen, pH and temperature (click on the picture of the sample bottles or the first link listed below to see the 2016, 2017, 2018, 2019, 2021, 2022, 2023, 2024 and 2025 data – sampling was suspended in 2020).
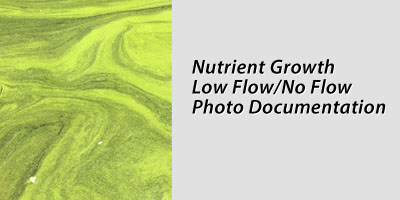
The TRWA has been testing some of these sites since 1999. This citizen collected data forms a picture of the watershed’s health and keeps the spot light on areas and actions needed for further improvement. Our volunteers also take periodic pictures (click on the picture of the green algae bloom below to see some pictures).
The primary water quality problems in the Taunton River watershed are driven by excess nutrients (nitrogen and phosphorus) and stormwater runoff. Global warming is causing extreme weather consisting of both periods of more intense rainfall and periods of drought. Sea level rise and rapid development is exacerbating the water quality problems. Nutrient pollution causes algae to grow and fish & native aquatic vegetation to die. Stormwater runoff transports bacteria, nutrients and toxins to our waters causing water quality standards violations. Stormwater washes beneficial aquatic life out of streams disrupting stream ecology.
How to fix these problems:
- The first step was upgrade all 7 major wastewater treatment plants (WWTPs) in the watershed to remove nitrogen and the 4 upriver plants that discharge to freshwaters to also remove phosphorus.
- Middleborough, Mansfield and Brockton WWTPs have been upgraded for nitrogen and phosphorus removal.
- Taunton WWTPs completed construction in the Spring of 2025 of a plant expansion and upgrade which removes nitrogen (phosphorus removal is not required because the plant discharges to brackish rather than fresh water). Bridgewater has been upgraded for nitrogen removal and is scheduled for phosphorus removal in 2027.
- Somerset was reissued a new permit in 2024 which requires nitrogen removal by 2030.
- Fall River has a draft Clean Water Act (CWA) permit which came off public notice on 4/16/2024. This permit needs a nitrogen limitation and plant upgrade schedule like the other 6 major wastewater treatment plants in the Taunton River watershed received..
- Fall River must pick up the pace of combined sewer overflow (CSO) abatement. EPA said during the permit comment period that it also intended to issue an updated Administrative Order with a schedule of additional CSO discharge reduction projects to be completed over the next 5 years in coordination with the permit reissuance. To date EPA Region 1 has not taken any action to reissue this 20 years overdue permit and/or issue an updated CSO compliance Administrative Order.
- Improve regulation and control of stormwater run-off.
- MassDEP and municipalities must update their stormwater regulations for stormwater from new development. Stormwater from new development is the largest water quality threat the watershed is facing. TRWA supports the Watershed Protection Standard which has three components:
- Maintain pre-development groundwater recharge volume,
- Maintain pre-development nutrient (nitrogen and phosphorus) export loads from the site, and
- Maintain a resilient landscape as determined by response to extreme storms and with runoff managed to pre-development volume.
- EPA must update its Clean Water Act (CWA) Massachusetts Small Municipal Separate Storm Sewer System (MS4) General Permit which regulates stormwater from municipalities.
- EPA must use its Clean Water Act authority called Residual Designation Authority (RDA) to issue a RDA permit to require certain existing private commercial, industrial, and institutional sources of stormwater in the Taunton River watershed to control their stormwater run-off to reduce pollutants, including nutrients and bacteria, from entering the watershed. TRWA monitoring since 1999 and again in 2025 measured water quality violations for bacteria at all of our monitoring sites as well as increases of phosphorus after rain events.
- MassDEP and municipalities must update their stormwater regulations for stormwater from new development. Stormwater from new development is the largest water quality threat the watershed is facing. TRWA supports the Watershed Protection Standard which has three components:
Program Overview
TRWA monitors the main stem of the Taunton River at five locations Berkley to Bridgewater along with critical tributaries feeding the river at fifteen additional locations during the early morning hours the second Tuesday of each month April to October. The reason we do this is to provide the watershed a regular check-up essential to continue the focus on correction of previously identified problems and to identify new issues.
 Nitrogen is an important pollutant affecting the estuary and Mount Hope Bay. It comes from wastewater treatment plants (WWTPs) and other sources including stormwater runoff, excess lawn/turf/crop fertilization (and sloppy application of fertilizer i.e. on sidewalks, roads and driveways), pet wastes, stream bank erosion, stream buffer loss, and poor manure management from farming areas. A comprehensive state sponsored 2004 to 2006 study throughout the Taunton River Estuary and Mount Hope Bay SMAST, Summary of Water Quality Monitoring Program for the Mount Hope Bay Embayment System (2004 – 2006) (August 16, 2007) documented high algae and depressed dissolved oxygen attributed to high nitrogen loads. In 2012 EPA set an instream wasteload allocation total nitrogen (TN) target of 0.45 mg/l for the Taunton watershed. MassDEP uses an impairment listing level of 0.5 mg/l for TN. TRWA monitoring indicates improvement in nitrogen levels with the nitrogen removal upgrade of the Taunton and upstream WWTPs. Better management of stormwater by source control of residential, commercial and agricultural fertilizer application is necessary.
Total phosphorus is an important pollutant affecting the upper freshwaters of the watershed (main stem upstream of Taunton) and the tributary freshwater rivers/streams/lakes/ponds. Just as nitrogen is often considered the limiting nutrient in the estuarine portion of the watershed, phosphorus is the algae growth limiting nutrient in the freshwaters upstream. Monitoring has measured total phosphorus levels above the river target of 0.10 mg/l (0.05 mg/l is the target for lakes/ponds/impoundments) at a number of locations particularly after rain storms demonstrating the impact from stormwater run-off. The four up-river treatment plants (except Bridgewater scheduled for 2027) have total phosphorus removal capability. Phosphorus is a major pollutant in stormwater. Most stormwater run-off in the watershed is untreated which is why TRWA measures phosphorus increases in streams after rainstorms. Total phosphorus in stormwater can be effectively removed by stormwater infiltration. Until MassDEP and municipalities update their stormwater regulations for new development (discussed above) and EPA updates its MS4 stormwater General Permit and uses its Clean Water Act authority called Residual Designation Authority (RDA) to issue a RDA permit to require certain existing private commercial, industrial, and institutional sources of stormwater in the Taunton River watershed to control their stormwater run-off to reduce pollutants this problem will worsen with development and climate change.
Bacteria levels are high throughout the watershed due to untreated stormwater run-off. In 2019 TRWA changed its bacteria analysis to monitor enterococci bacteria a newer and more sensitive indicator to be consistent with the updated state water quality standards. Enterococci bacteria levels in excess of 35 colony forming units (CFU)/100 milliliters as a geometric mean for any 90 days, and more than 10% of all samples collected exceeding 130 CFU/100ml violate the state water quality criteria (effective 11/12/2021). In 2019 our first year using the new indicator we saw frequent criteria violations of the new standard. Results since that time including in 2025 show significant bacteria water quality criteria violations due to climate change induced intense rain storms and inadequate management of existing and new stormwater sources (see discussion of Watershed Protection Standard in number 2 above).
Over the last several years other parameters tested by TRWA (dissolved oxygen (DO), pH and temperature) have not exhibited unusual levels and/or water quality criteria violations observable by monthly grab surface sampling collected from the free-flowing main stem of the Taunton River and the main flow from its tributaries in the upper watershed where TRWA samples. We have seen a few occasional low pH values at a couple of sites which we intend to investigate further.
Low dissolved oxygen (DO) levels which do not meet water quality criteria are measured by MassDEP’s continuous monitoring buoys during summer. For example, low dissolved oxygen was measured during the summer of 2017 and 2018 as well as more recently in 2021 and 2022 at their continuous monitoring buoys in Mount Hope Bay south of the Braga bridge and at the mouth the Cole River (see TRWA Google map for buoy locations). Low DO, high chlorophyll-a and elevated nitrogen were measured demonstrating the need to reduce nitrogen loads in the Taunton River estuary and Mount Hope Bay.
Nitrogen induced eutrophication in the estuary threatens the endangered Atlantic sturgeon, Winter Flounder, Sea Run Brook Trout and the ability of the Taunton watershed and Mount Hope Bay to support the thriving balanced indigenous population of fish, aquatic life and wildlife we all want to see throughout the watershed.
Documents:
Link to TRWA Monitoring Results Data Page (on TRWA Website)
Volunteer Monitoring Program Forms and Information:
- Google map of monitoring, wastewater treatment plant, and MassDEP monitoring buoy locations
- One page summary of nitrate, total phosphorus (TP), enterococci, DO, pH/TSS sampling procedures (PDF)
- Blank 2025 monthly nitrate, TP, and enterococci reporting table indicating duplicate and blank sampling locations (PDF)
- Blank 2025 monthly dissolved oxygen, TSS, pH, and temperature reporting table indicating duplicate sampling locations (PDF)
- Blank Water Quality Monitoring and Chain of Custody Sheet (PDF)
- Instruction and an example of how to fill out the contract lab sample bottles for enterococci, nitrate, and total phosphorus (PDF)
- TRWA Sampling Program Standard Operating Procedures (SOP) (PDF)
- MassDEP Approved Quality Assurance Project Plan (QAPP) (PDF)
Important Quotes from First Circuit Court of Appeals Concerning Losing Nutrient Limit Permit Appeals
- Upper Blackstone Pollution Abatement District (Greater Worcester, MA area) (PDF)
- City of Taunton Permit Appeal (PDF)
2017 Taunton River Watershed Report Card (PDF)
2016 Taunton River Report Card (PDF)
2016 to 2014 Taunton River Water Quality Report Cards (PDF)
Taunton River Watershed CWA Permit Nutrient Compliance Schedules (PDF)
CWA Permit Re-issuance History and Current Status (PDF)
MassDEP Letter 11-18-2018 Mount Hope Bay Not Meeting Water Quality Standards
MassDEP Letter 7-29-2018 Mount Hope Bay Not Meeting Water Quality Standards