TRWA is pleased to announce the TRWA Volunteer Water Quality Monitoring Program will resume on Tuesday, August 10, 2021 this year! Existing and new volunteer monitoring training will be held Saturday, July 31, 2021 at TRWA’s Sweets Knoll State Park Office in Dighton, MA (on Rt 138 just South of the Bristol Aggie traffic light – 1387 Somerset Avenue, Dighton, MA). On July 31st we will have sign-in and an informal get acquainted and Q/ A session from 9:30am to 10:00am and the training will run from 10:00am to Noon. If you want to participate but can’t make the July 31st training date, contact the TRWA office at director@savethetaunton.org and we’ll see if a make-up day is needed.
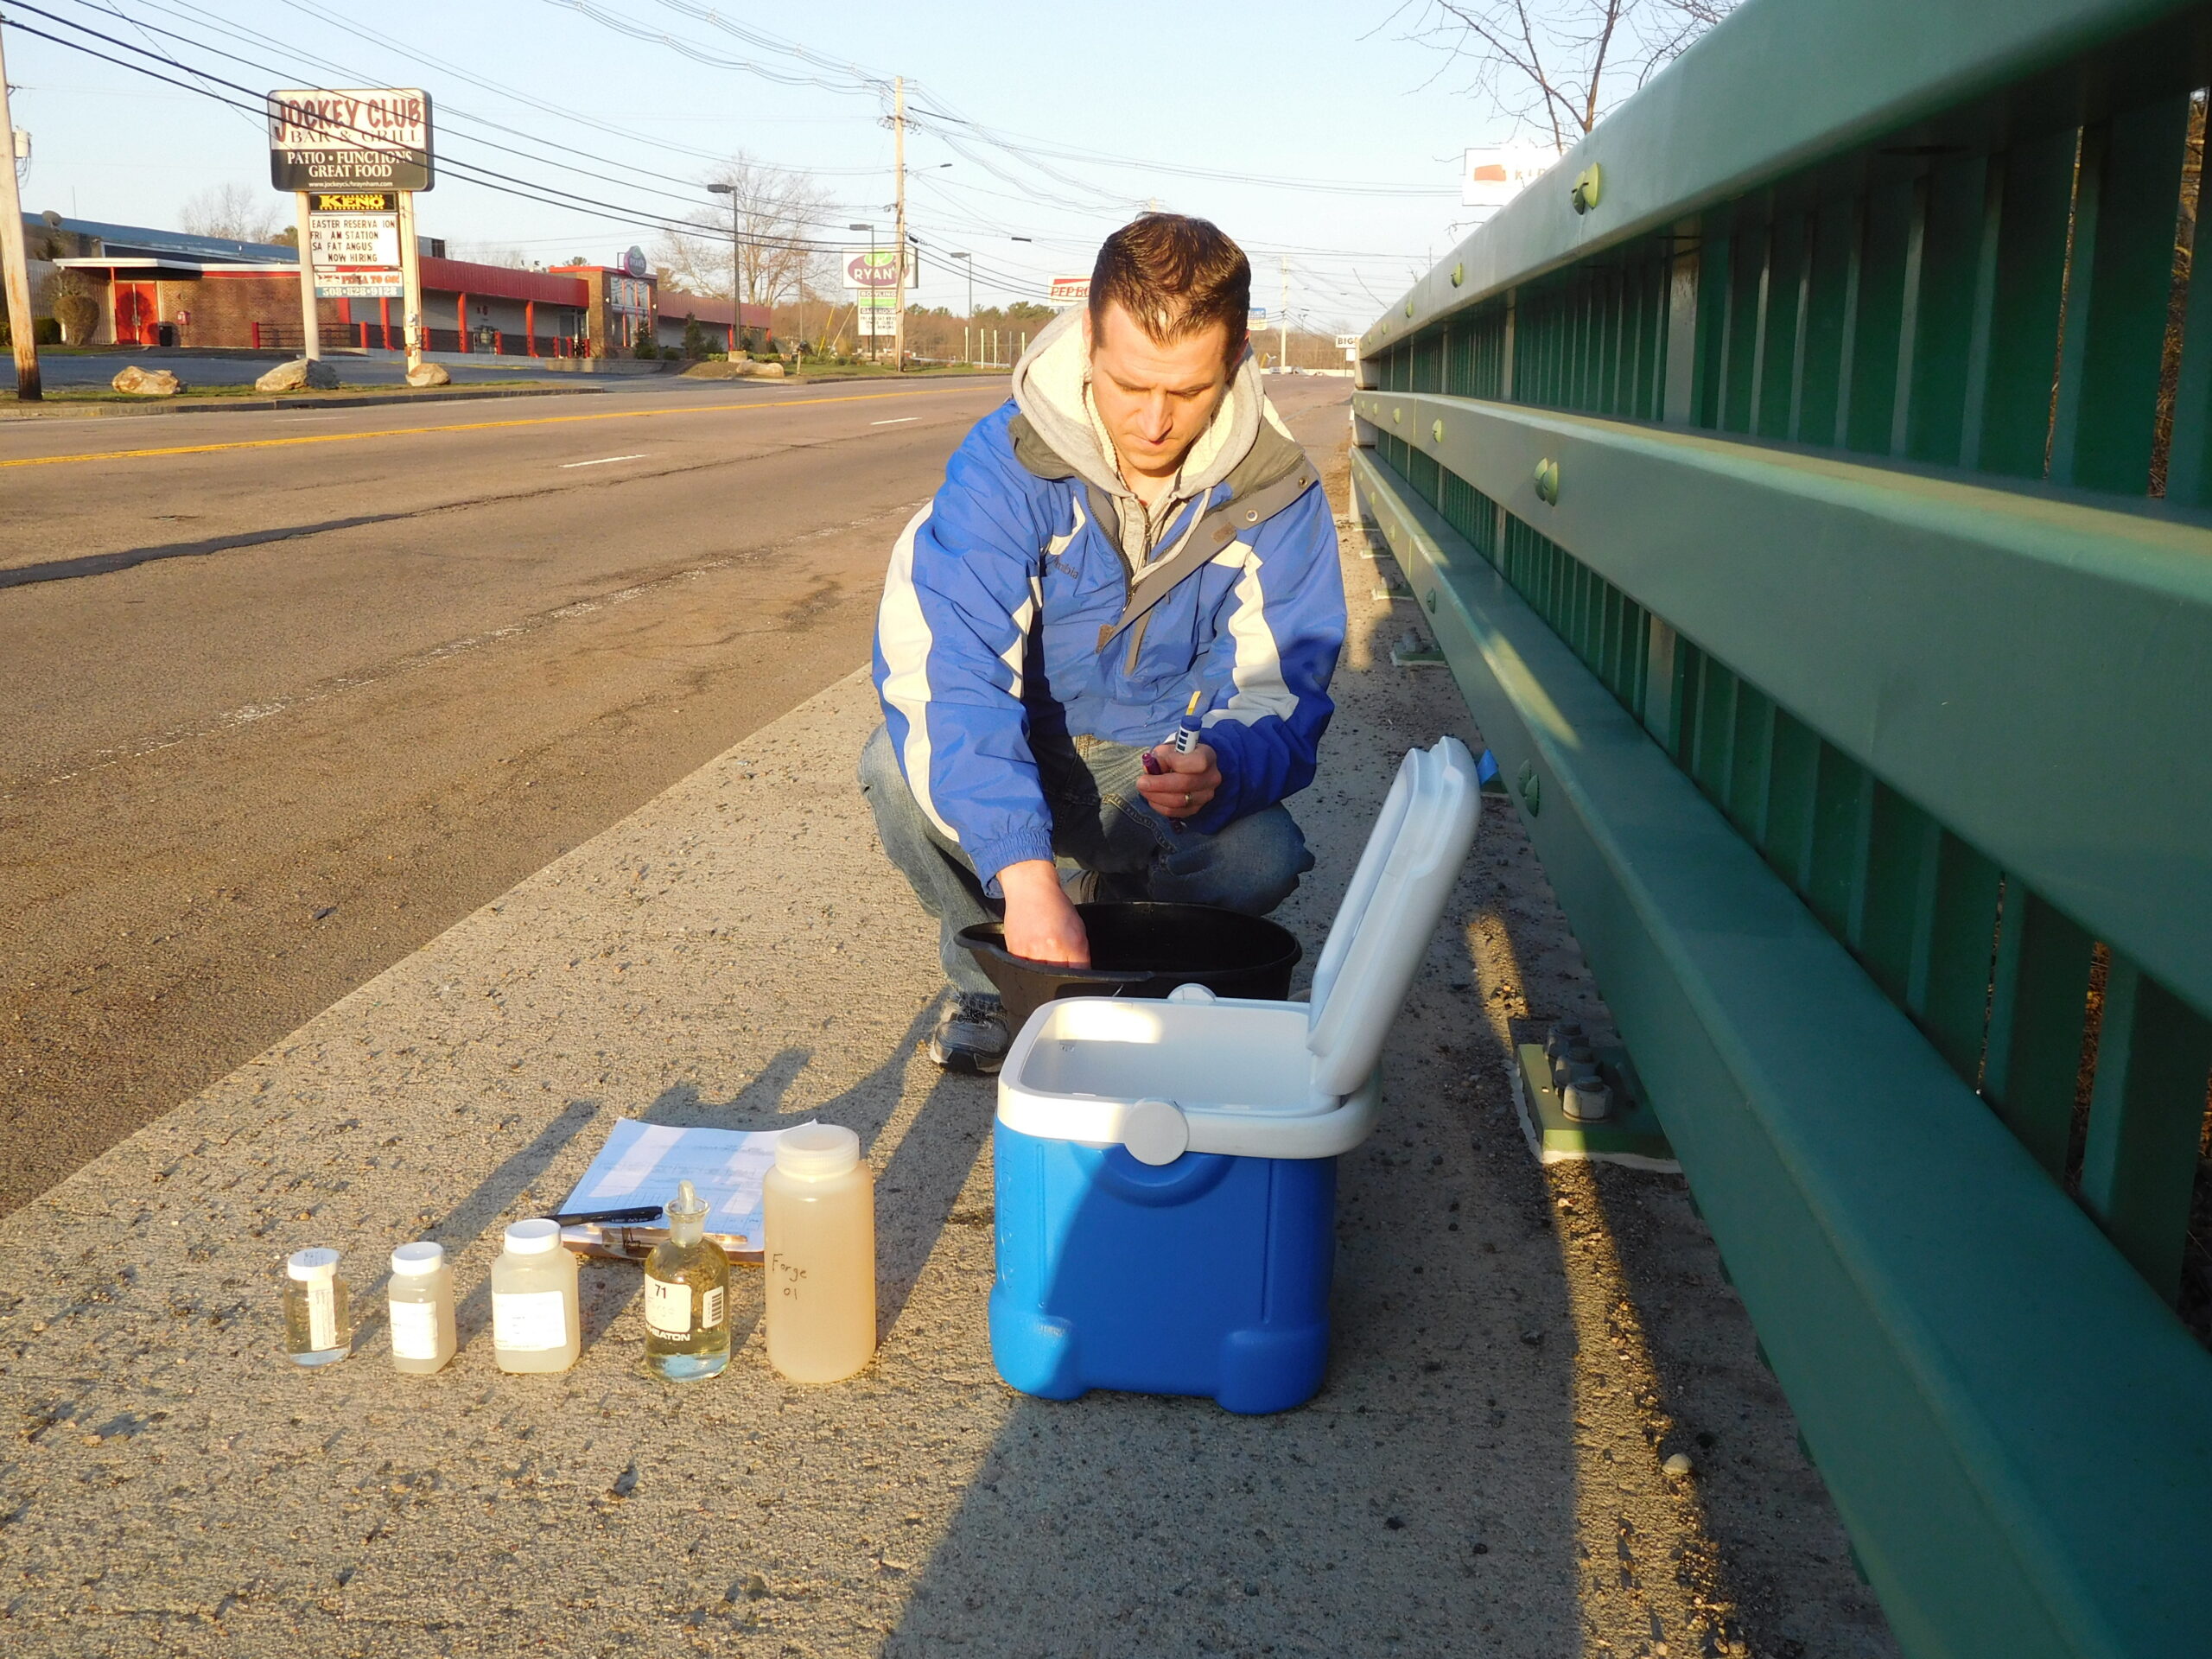
TRWA volunteers will sample the first Tuesday of the month for the remainder of the sampling season August, September, and October (3 months). Teams take their samples form 2 or 3 locations anytime between 5:00am to 8:00am and drop them off at the Taunton WWTP lab no later than 8:30am. As we have done in the past, and as noted above the refresher sampler/new volunteer training is on the last Saturday morning of the month before sampling begins which is Saturday, July 31, 2021 this year.
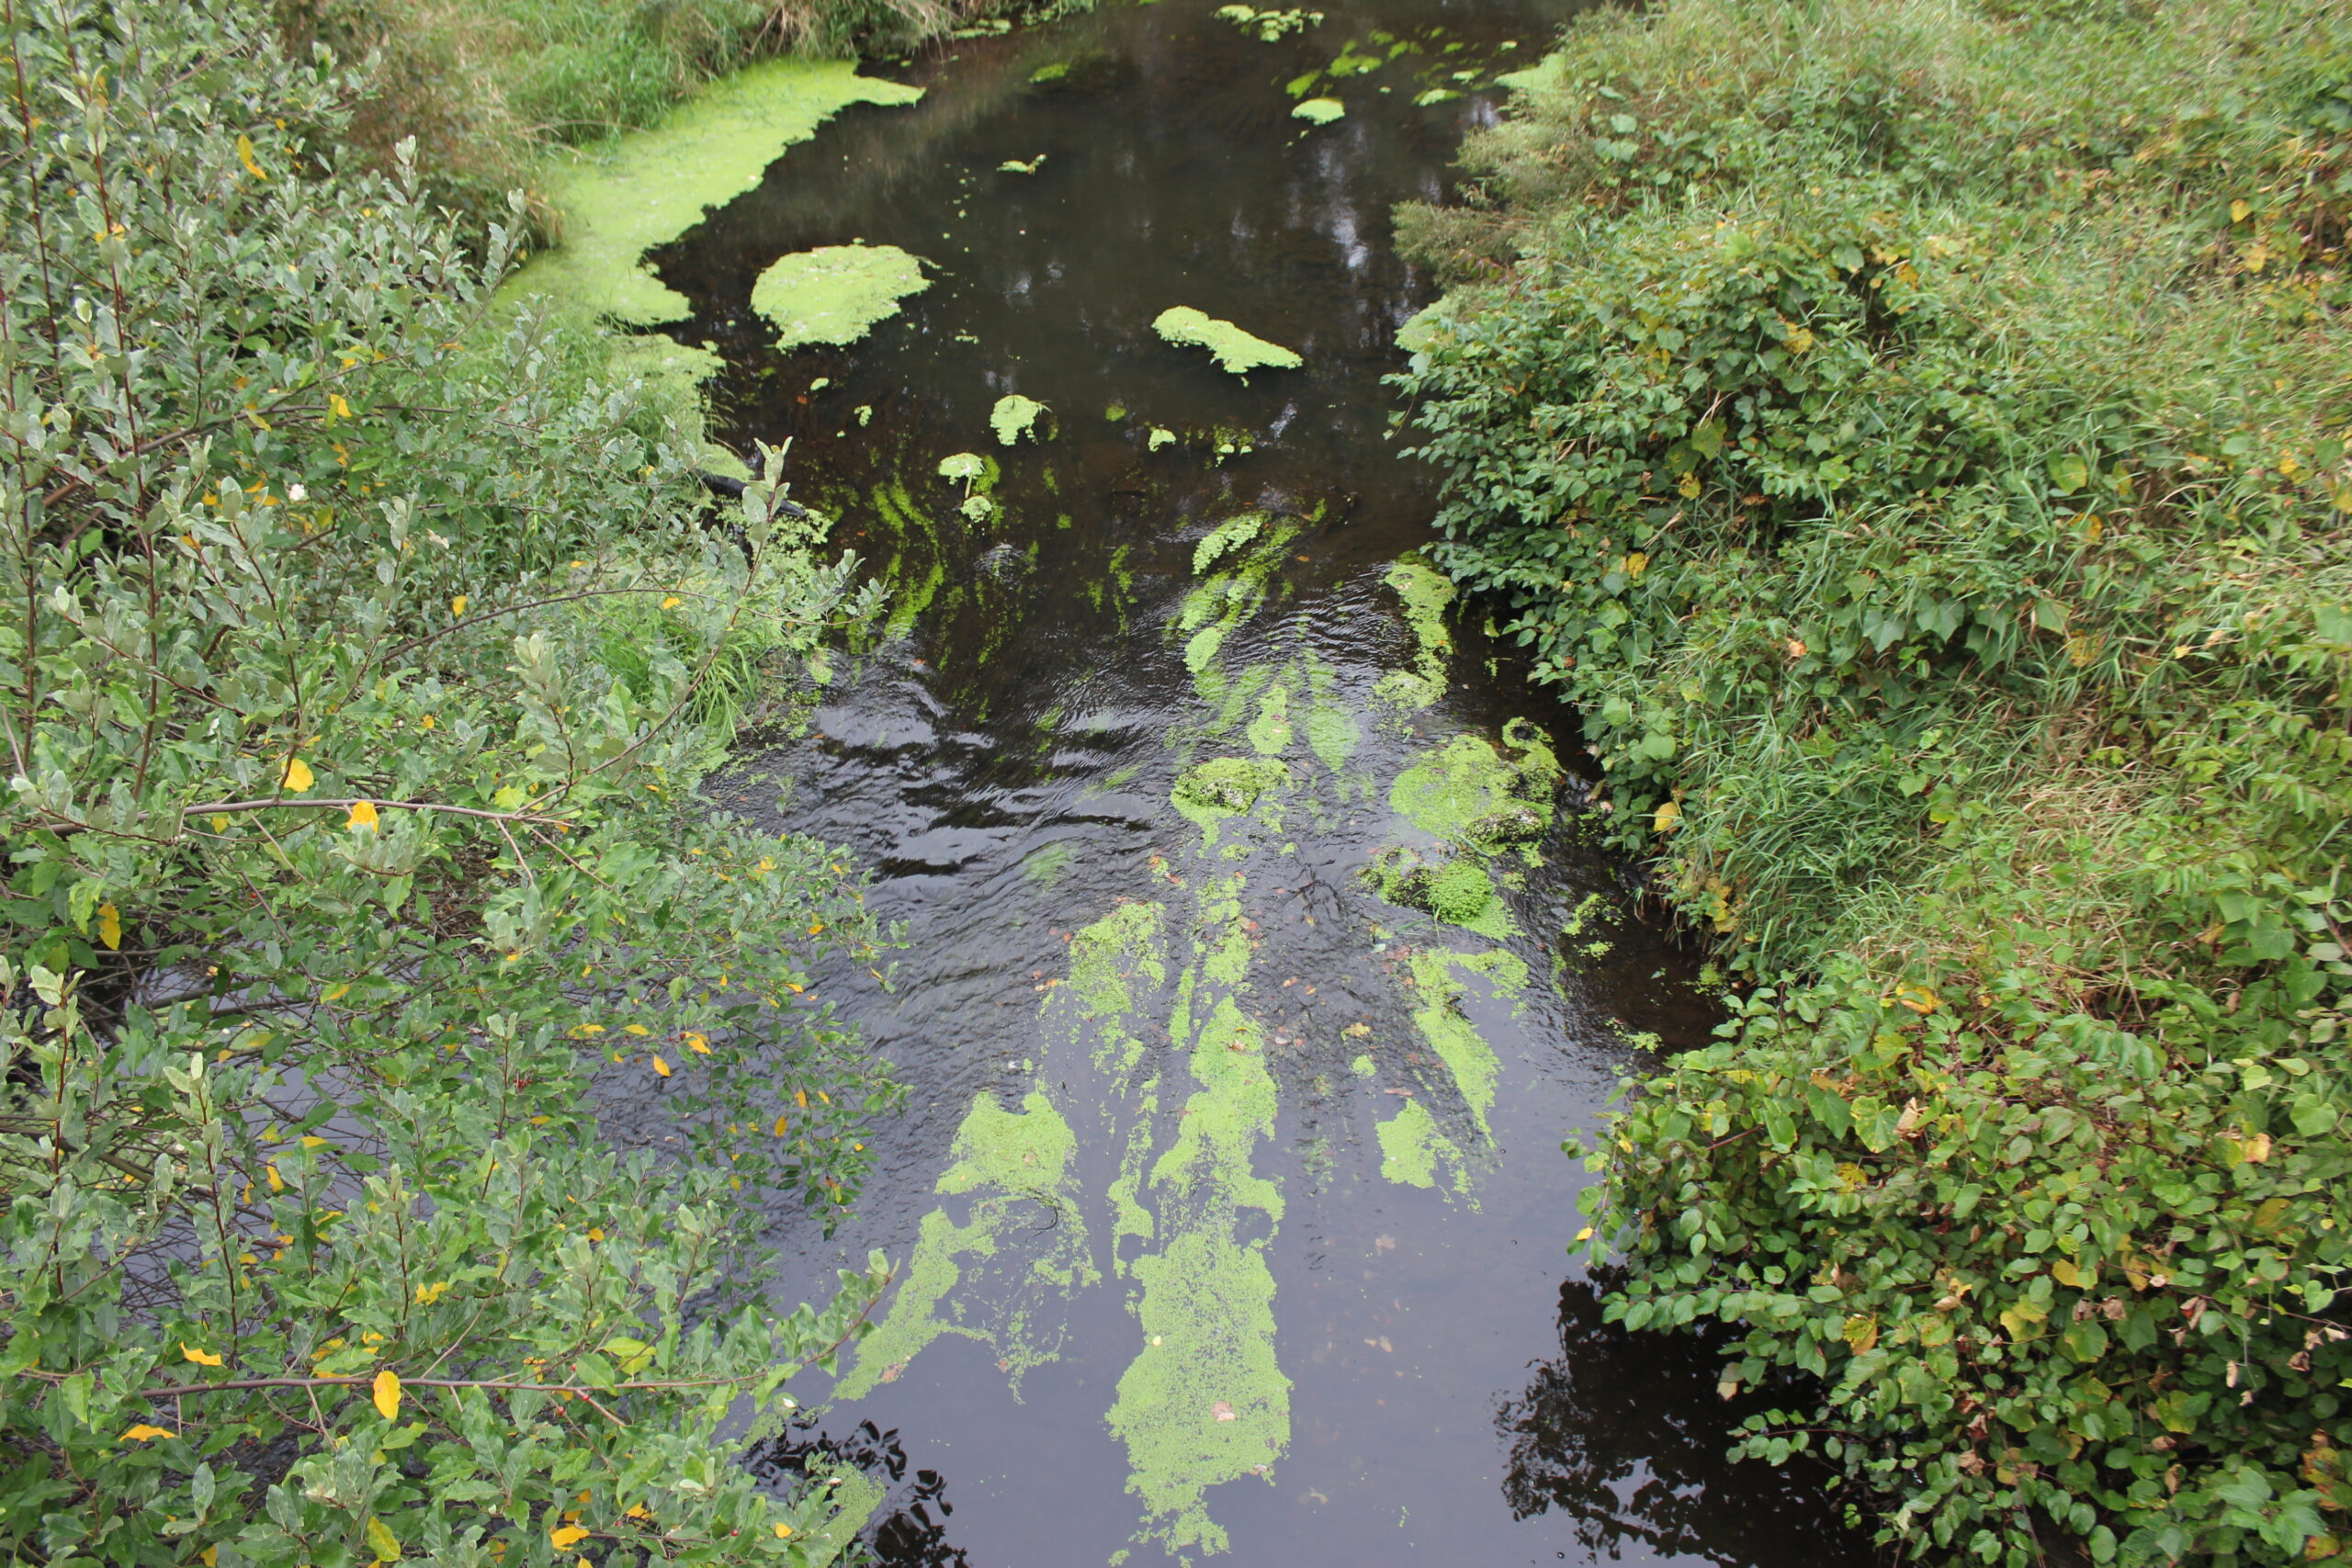
August is an important month for water quality monitoring. As the veteran samplers know TRWA teams of volunteers sample 20 locations (4 on the main stem of the Taunton River and 16 locations on tributary rivers/streams) the second Tuesday of each month during our sampling season (normally April through October). We have a MassDEP Quality Assurance Plan approved sampling program. We do 2 duplicates and 2 blanks each month (1 for every 10 samples for Nitrate, Total Phosphorus and Bacteria the most important pollutants we monitor). TRWA monitoring is important because it documents along with MassDEP Mount Hope Bay continuous monitoring the need for upgrading all seven major wastewater treatment plants (WWTPs) in the watershed to remove nitrogen and for the four WWTPs in the upper freshwaters of the watershed to also remove phosphorus. It also highlights the need across the entire watershed for better stormwater controls for new and existing development to reduce bacteria, nitrogen and phosphorus pollution from stormwater discharges.
TRWA delayed the start of the sampling program to give our volunteers time to obtain their vaccinations so we can be safe working with each other and so we won’t risk bringing the virus to our program partners at the Taunton wastewater treatment plant. For both the training and sampling we are following CDC Guidelines. Those that are fully vaccinated (2 weeks after their second dose in a 2-dose series, such as the Pfizer or Moderna vaccines, or 2 weeks after a single-dose vaccine, such as Johnson & Johnson’s Janssen vaccine) can participate normally. Those not fully vaccinated or with a compromised immune system must wear masks and practice social distancing.
We look forward to seeing you at the training session on July 31st. If you are a veteran sampler and your team needs sample bottles you can contact Rick McCormack at the Taunton WWTP lab (508-823-3582) to make arrangements to pick them up or contact Steve Silva the sampling program coordinator (steve124@gmail.com). The TRWA 2021 Standard Operating Procedures guide is on the TRWA website https://savethetaunton.org/ at the monitoring tab as well as our simple one-page sampler instructions sheet, chain of custody form, instructions for filling out sample bottle labels, Google map of sampling locations, and 2021 blank reporting forms which show in the lower section which locations/teams will collect duplicate and blank samples each month. This webpage generally has anything you might want to review concerning the sampling program.
One of the most important things we want to accomplish at the training is to ensure that we have teams of people with at least one veteran sampler ready to cover each sampling location. We will assign new volunteers to teams with veterans for hands-on training and to ease them into the program. If you know anyone who might like to get fresh morning air, knowledge, and be part of an important effort to save our environment, please invite them to the training.
If you are a veteran sampler and are no longer able to participate in the sampling program, please let Steve Silva (steve124@gmail.com) know to help us with planning.