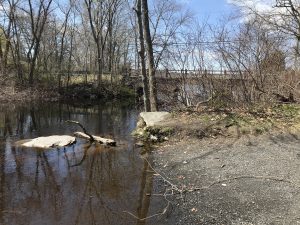
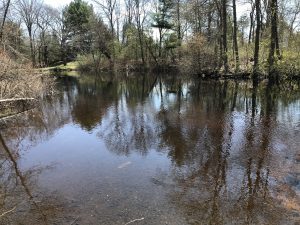
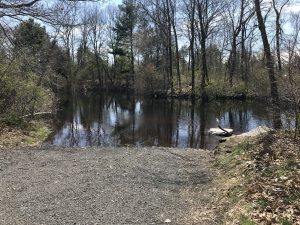
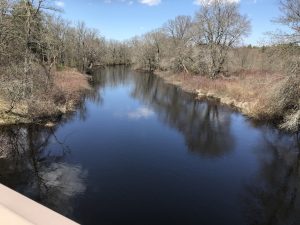
Taunton River at Titicut Street bridge

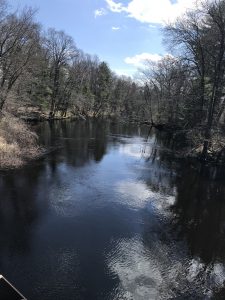
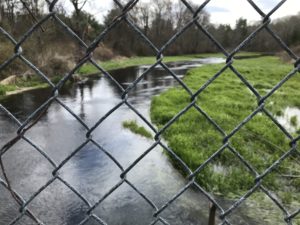
Taunton at Titicut, upstream

Taunton at Titicut St, upstream

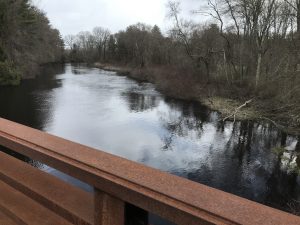
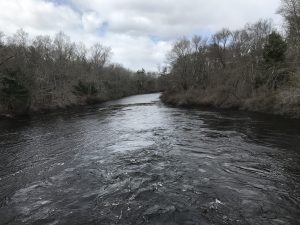
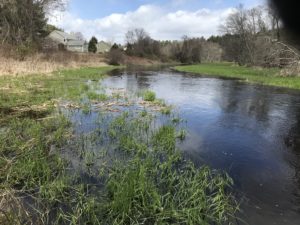
Taunton at Titicut St, downstream

Taunton at Titicut St, downstream

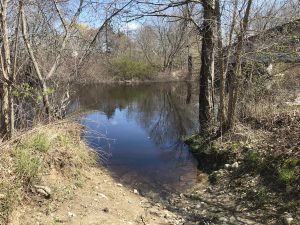
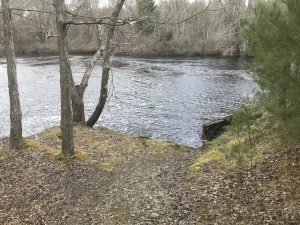
Taunton at Titicut St put-in

Taunton at Titicut St put-in


This is one of my favorite put-ins for a group trip. Usually there is 6-8ft of beach and wide enough to fit 12-15 kayaks easily. This week, there’s no beach … and the water is really moving. What’s usually a little flurry under the bridge might be now classified as a class 3 rapid. Be aware of this spot should you decide to put in at Summer St on the Taunton, Murdoch St on the Nemasket or anywhere further up the Nemasket River.

If you want to see the video to see how fast it’s moving click here.

The downside to this put-in is the lack of parking. People have to load/unload in the street with cars & trucks whizzing by and the path down to the put-in is full of poison ivy.

I’ll be posting more locations over the next few days. Stay tuned.

~Monica Bentley
TRWA River Guide

Fast current, low bridges and cold water

Nemasket at Plymouth St looking upstream

Nemasket at Plymouth St looking downstream

Nemasket at Plymouth St

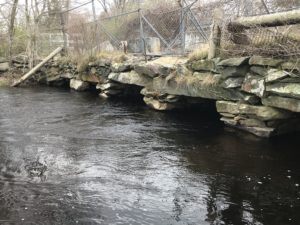
Historic Plymouth St bridge over the Nemasket River


If you want to see the video to see how fast it’s moving click here.

Over the past few days I’ve been out checking river conditions and – I can’t believe I’m saying this – but I’m glad it’s too cold to paddle. The river conditions are pretty scary. And I’m one who likes to be out at the end of March or early April! We usually do our first trip on the upper Nemasket because it’s wide and calm. But the currents this year are a bit faster than normal due to all the rain. Plus – we can’t shuttle back up the river with the CDC corona virus guidelines.

This is the lower Nemasket River at Plymouth Street. The current is quick, and trying to get under this bridge with its headspace that slopes down as you go through would be pretty treacherous. There is a set of steps that you could use to launch and the bottom step is about 6 foot long. That step is currently about a foot under (cold) water.

I’ll be posting more locations over the next few days. Stay tuned.

~Monica Bentley
TRWA River Guide

Earth Day and Covid-19

Wednesday, April 22, is the 50th anniversary of Earth Day, and it’s safe to say no one expected we’d be celebrating it indoors during a planet-wide pandemic. In 1970, more than 20 million people participated in the first Earth Day. Once public health authorities say its safe to do so TRWA will resume its many free public events in the watershed. Until then we appreciate the efforts our members are making to follow CDC guidelines and keep each other safe. Thank you for your support of TRWA and each other through this difficult time.

March 28th Sampler Training Cancelled; TRWA Monitoring Program Suspended

In order to protect our volunteers and their families and following the direction of public health authorities, TRWA is cancelling the March 28th TRWA new and existing volunteer sampler training session we had previously scheduled. We are also suspending our citizen monitoring program which was planned to start on April 14th until further notice.

When we are advised by government and public health authorities that it is safe to do so we will reschedule our training session. Similarly when information from public health authorities and our partners at Veolia indicate that it is safe to do so we will resume our monthly sampling program.

Do not hesitate to contact our office if you have any questions.

CANCELLED – TO BE RE-SCHEDULED – TRWA Volunteer Monitoring Training Saturday, March 28, 2020, 9:30 AM to Noon

CANCELLED – NEW DATE TO BE ANNOUNCED WHEN AVAILABLE

Come help us make sure our water stays clean!

The Taunton River Watershed Alliance has done water quality testing in the Taunton River and its tributaries since its inception in 1988. The information gathered shows that ongoing efforts to clean up the river are necessary and effective. Each bucket of water pulled up to be tested can have national implications. It already has and must be continued to keep our water clean and our 43 communities informed and accountable.

TRWA currently has 20 sample collection volunteers who work in 10 teams collecting samples from 20 locations from Berkley to Bridgewater the second Tuesday morning of each month from April through October. Volunteers work in teams of 2 to 3 people (to provide back-up coverage for vacations etc.) and each team collects samples from 2 or 3 locations bringing samples back to the Taunton wastewater treatment plant by 8:30 am.

No technical training or education is required just a desire to be part of an important effort with good people who want to improve local water quality. We provide the training, pair new people with folks who are veterans, and explain what the results mean and why they are important.

We are looking for new volunteers to replace some samplers who have moved out of the area, can no-longer volunteer, and to make some of our teams a little bigger. Anyone who thinks they may be interested in becoming one of our guardians of the river should come to our training session on Saturday morning, March 28, 2020, 9:30am – Noon at TRWA’s River Center, Sweets Knoll State Park, 1387 Somerset Avenue, Dighton, MA. There is a lot of information about the monitoring program on the TRWA website. People with questions may also send an email to the volunteer monitoring program coordinator Steve Silva at steve124@gmail.com.

If you know anyone who might be interested in helping us with this effort (friends, neighbors etc.) please invite them to come to the training with you. There is no obligation to volunteer if you come. We will have coffee, juice and some refreshments. You will have a chance to meet our diamond back terrapin (a threatened brackish water turtle) mascot who we have adopted because she can’t be returned to the wild and visit scenic Sweets Knoll State Park.

We are also looking for sponsors for this program so we can continue to pay for the water testing. For more information view our sponsorship sheet or the website.

Read more about the program

October Nitrate, Total Phosphorus and Enterococci Bacteria Results

The October nitrate, total phosphorus, and enterococci results are back from our contract lab and have also been added to the website monitoring data page. These are the last results for the 2019 monitoring season which runs from April through October so we can look at not only the month of October but the year as a whole.

The October results for 2019 are a little worse than October 2018 but looking at the May to October averages for both years they are very similar. Both 2018 and 2019 were relatively similar, wet years providing high wastewater treatment plant (WWTP) dilution. Results for nitrate our most critical water quality parameter because of the impact of excess nitrogen on the ecology of the estuarine portion of the river and Mount Hope Bay look better in 2019 and 2018 (two recent wet years) than 2017 and 2016 (two dry, low river flow years) because of the higher river flow dilution.

We see the highest levels in the upper watershed (locations MAT-01, TWH-01, and CHE-01) reflecting the fact that Brockton and Bridgewater have not completed required upgrades to remove nitrogen yet. Brockton and Bridgewater are scheduled to remove nitrogen in April and May of 2022 respectively. Despite looking better than the more typical dryer summers of 2016 and 2017 the nitrogen levels in the upper watershed were still 3 to 4 times what they should be and levels in the lower river were approximately 1.5 times the EPA and MassDEP water quality criteria targets established for the Taunton River.

A good news story is that the Nemasket River had low nitrate levels all year reflecting the completion of the upgrade of the Middleboro wastewater treatment plant early last year. The Mansfield/Norton/Foxboro nitrogen removal upgrade is scheduled to go on line in early 2020 which should help the Three Mile River.

The most critical upgrades we are looking forward to in order to lower nitrogen levels throughout the river are Taunton, Brockton, and Bridgewater which are required to remove nitrogen by 2022. We are hoping EPA and MassDEP will assure Taunton, Brockton, and Bridgewater comply with their permit schedules to complete their upgrades by 2022 and resume Clean Water Act permitting in the Taunton River watershed by issuing the remaining two major permits Somerset and Fall River with WWTP upgrade schedules.

As mentioned last month we are carefully watching the new enterococci bacteria testing results. As we accumulate more data on this parameter, we will get a better idea of seasonal fluctuations and potential sources.

In a final piece of monitoring news TRWA received MassDEP approval of its Quality Assurance Project Plan (QAPP) on October 2, 2019. TRWA is one of the few citizens volunteer monitoring programs with an approved QAPP which means the Commonwealth can use our data in development of the biennial 303(d) list of Impaired Waters developed by all states every even year pursuant to the Clean Water Act.

We appreciate the hard work and dedication of our volunteers and the support of our TRWA members and donors who make this effort possible!

September nitrate, total phosphorus, and enterococci results

The September nitrate, total phosphorus, and enterococci results have been added to the website.

The results for nitrate our most critical water quality parameter because of the impact of excess nitrogen on the ecology of the estuarine portion of the river and Mount Hope Bay look better than 2018 and much better than 2017 and 2016 (two low river flow years). We see the highest levels in the upper watershed (locations MAT-01, TWH-01, and CHE-01) reflecting the fact that Brockton and Bridgewater have not completed required upgrades to remove nitrogen yet. Brockton and Bridgewater are scheduled to remove nitrogen in April and May of 2022 respectively. Despite looking better than last year the nitrogen levels in he upper watershed are still 3 to 4 times what they should be to protect downstream waters.

The good news story in the Nemasket River continues. Compared to 2017, nitrate levels in the Nemasket River are low this year (and most of last year) likely reflecting the completion of the upgrade of the Middleboro wastewater treatment plant early last year. The Mansfield/Norton/Foxboro nitrogen removal upgrade is scheduled to go on line in early 2020. We are looking forward to lower nitrogen levels throughout the river when Taunton, Brockton, and Bridgewater are all removing nitrogen by 2022. We are hoping EPA and MassDEP will resume Clean Water Act permitting in the Taunton River watershed soon so the remaining two major permits Somerset and Fall River will be reissued with upgrade schedules.

As mentioned last month we are carefully watching the new enterococci bacteria testing results. Levels in August and September were mostly lower than in May through July potentially as a results of lower stormwater contributions of bacteria (from contaminated rainwater runoff). In August and September half of our samples still exceeded the state criteria for enterococci bacteria but the magnitude of the violations was lower than May through July except for a September sample at Haywood St. from the Town River in Bridgewater. As we accumulate more data on this parameter, we will get a better idea of seasonal fluctuations and potential sources.

August Nitrate, Total Phosphorus, and Enterococci Results

The August nitrate, total phosphorus, and enterococci results have been added to the website. The results for nitrate our most critical water quality parameter because of the impact of excess nitrogen on the ecology of the estuarine portion of the river and Mount Hope Bay look comparable to 2018 and better than 2017 and 2016 (two low river flow years). We see the highest levels in the upper watershed (locations MAT-01, TWH-01, and CHE-01) reflecting the fact that Brockton and Bridgewater have not completed required upgrades to remove nitrogen yet. Brockton and Bridgewater are scheduled to remove nitrogen in April and May of 2022 respectively.

A good news story is that compared to 2017, nitrate levels in the Nemasket River are low this year most likely reflecting the completion of the upgrade of the Middleboro wastewater treatment plant early last year. The Mansfield/Norton/Foxboro nitrogen removal upgrade is scheduled to go on line in early 2020. We are looking forward to lower nitrogen levels throughout the river when Taunton, Brockton, and Bridgewater are all removing nitrogen by 2022. We are hoping EPA and MassDEP will resume Clean Water Act permitting in the Taunton River watershed soon so the remaining two major permits Somerset and Fall River will be reissued with upgrade schedules.

The other results we are watching are the new enterococci bacteria testing results. Levels in August were lower than in May through July potentially as a results of lower stormwater contributions of bacteria (from contaminated rainwater runoff). In August half of our samples still exceeded the state criteria for enterococci bacteria but the magnitude of the violations was lower. As we accumulate more data on this parameter, we will get a better idea of seasonal fluctuations and potential sources.


July Nitrate, Total Phosphorus, and Enterococci Results

The July nitrate, total phosphorus, and enterococci results are posted in the data section of the website. In July with flows falling slightly nutrient pollution levels (nitrate and total phosphorus) are up because the wastewater treatment plant (WWTP) discharges are not being diluted with as much natural river flow.

As in past years nitrates in particular are on the rise and a concern exceeding the safe estuarine levels designated by EPA and MassDEP for the Taunton River and Mount Hope Bay (see levels in bold red on our spreadsheet). Fortunately the WWTPs in the watershed are under permit schedules to reduce nitrogen. Middleboro completed its upgrade in 2018 and we have seen a reduction in nitrogen and phosphorus on the Nemasket River which it discharges into. The Mansfield/Norton/Foxboro upgrade is scheduled for the end of 2019. Taunton’s phase 1 upgrade is due July 2021. Brockton is scheduled for April 2022 and Bridgewater phase 1 May 2022. Since EPA and MassDEP estimate that 2/3 of the nitrogen load to the river and estuary system is from WWTPs these upgrades are important and eagerly anticipated.

TRWA’s monitoring as well as continuous monitoring by MassDEP during 2017 and 2018 at the mouth of the Taunton River in upper Mount Hope Bay indicate that these upgrades are essential.

The other interesting element of our July results is the frequency of enterococci bacteria water quality criteria violations being detected using the MassDEP’s new indicator. The magnitude of violations fell slightly in July possible because of lower stormwater flows prior to our sampling days, however violations were measured at most locations. We are very interested in seeing the levels we measure with this new indicator for the remaining three months of our sampling season.

June Nitrate, Total Phosphorus and Bacteria Results Available

The June monitoring results for nitrate and total phosphorus two important nutrients affecting watershed water quality and bacteria (enterococci bacteria) used to assess swimming safety have been posted on the Water Quality Monitoring Results page of the website.

When TRWA sampled on June 18th the river flows were still high so we are far from summer peak stress conditions for nitrate and total phosphorus concentration. Despite the high WWTP dilution we saw some high nitrate levels below the Brockton WWTP (Matfield River and upper Taunton River) and below the Taunton WWTP (Taunton River at Berkley Bridge). Levels of total phosphorus were also borderline high at these locations..

The most interesting results are the high enterococci bacteria results measured throughout the watershed. We switched from fecal coliform to the newer enterococci bacteria indicator in May of this year. The May and June results seem to indicate that this indicator is more sensitive than the fecal coliform test we used in the past. The high results may be due to stormwater runoff indicating we need to do a better job managing stormwater in the watershed considering all the rain we have had.

It will be interesting to see what the enterococci results show during dryer weather this summer.